In HDX we use a variety of compression and text recognition algorithms to ensure bandwidth is used efficiently but also that screen elements like text or CAD wireframe/hidden-line are clear and sharp. When testing graphics protocols, we often try to ensure that we don’t just look at the average or mass usage case (in the case of a product like XenDesktop that’s often test workloads like Microsoft Office on windows laptops as the end points). We also look at those use cases which are most challenging e.g. using very old and low-powered Linux thin-clients as end-points because if we can get performance and quality in such scenarios the user experience is better for all our users.
In the case of text quality, we often look at non-English fonts because compression artefacts often are more perceivable to the user under the same conditions compared to English. Someone asked me a few weeks ago why this was. I’ve explained before about some of the underlying principles of compression techniques and how they affect the appearance of text, describing text challenges for H.264 codecs, read it here; I also wrote about the challenges of text due to the underlying Fourier compression techniques used in JPEG (read it here). However, this time when asked I tried to explain without resorting to too much maths.
I had actually just seen this “motivational image” on facebook and it was perfect for explaining some of the concepts, “Connect the dots”:
This is an exercise where you connect every possible vertex to every other. I can hear some thinking but how does that work with smooth text – basically you have infinite dots so every part of a letter has a line to every other part, but of course when pixelated it’s not an infinite but a finite number of dots).
Now imagine doing the same with a piece of Chinese text, google translate tells me that in simplified Chinese “Connect the dots” is:
连接点
(In traditional Chinese it is apparently: 連接點).
Things we can see when looking at the Chinese text:
- Characters represent whole words not just individual letters, there is simply a lot more information in each character than in English
- Each character has less null information (less white space)
Now if we play “Connect the dots” with the vertices in Chinese, we would find:
- We will get more lines than with English
- We will get a lot more small connecting lines than with English, small lines are small scale (also known as high-frequency) information
Jpeg compression generally works in part by throwing away higher-frequency components, so Chinese text is more vulnerable to degradation when compressed. In adaptive HDX technologies this occurs when bandwidth becomes severely constrained and compression is increased to compensate, it usually indicates a networking issue or a badly configured system with too many users for the bandwidth available.
OK – A bit of Fourier Maths – I Couldn’t Resist!
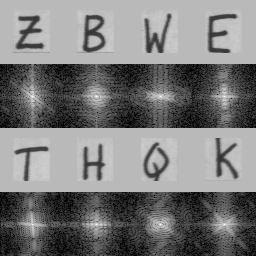
I found this super web-site that is suitable for someone with some level of university maths, https://www.cs.unm.edu/~brayer/vision/fourier.html, on it you can find a proper mathematical explanation but what did catch my eye was this series of images of letters (credits to the original website):
Some English letters have been transformed in to a Fourier Representation. What can we see:
- Most of the structure in the transforms is concentrated near the centre of the image – this represents large scale information
- The outer regions of the transforms are mostly black (contain very little information)
- The outer regions usually contain small scale information, so letters where you get more small lines when you play connect the dots, have more white (information) towards the edges of the transformed images e.g. Q and Z are a bit more smeared out that the simpler T or E
Chinese characters would be a lot more spread out with a lot more white towards the edge of transform images. Parts of Jpeg compression essentially trims out the outer regions of those transformed images sending a smaller central square and then retrieves the original image with a bit of information lost (imagine just overlaying the central cut out on a black square the original size), so complex characters with small features like Chinese loses more information.
The original covers similar features of Fourier transforms on all sorts of images, text, photographs and so on, better than I have so I would recommend skimming through the maths and looking at the images and the observations later on in the article.
I wonder if that made sense…. Feedback welcome!


Very cool. I experimented long ago as to whether FFTs of stellar spectra could possibly be used as a means of classifiying different types of stars, since there are different absorption and emission lines present in them that are quite distinguishable and repeatable in similar stars and after all, humans just do a one-on-one comparison to perform this sort of classification all the time by eye. There were a lot of issues with different slopes in the continuuum, low resolution images to work with, image flaws, etc. that made this impracticle for th ematerials at hand, but it’s been intriguging for some time that FFTs (more correctly, DFTs) appeared that they could be used as classifiers.
Another interesting parallel is H.265 compression. Instead of dividing up an image into similarly-sized squares and compressing each, the more efficient way used is to identify areas of similar composition, that is to say, large more blank areas as well as smaller areas with a lot of deviation and structure. This way, the focus is put on processing the more compelx areas and with not too “busy” images, you spend overall less time on th ecompression since you have fewer regions to process. This is particularly important since 4k images have an order of magniture more pixels than those with the H.264 format and need to be transported efficiently as possible.
LikeLike
Hi Tobias,
Pure Fourier tends not to be great for astrophysics classification as the modes in a fft are essentially spatially infinite and localised in frequency. In general a localised basis set probably is better… I did a bit of this a long time ago… http://arxiv.org/pdf/astro-ph/0401160v1.pdf On some Hubble data. Basically a mode that is similar to the object gets more power in the low order modes and you lose less in the side lobes of the transforms… Multi-scalar is an interesting one for image transfer… I’ve still not got my head around h.264 macroblocking… As ever the cpu cost to value is a hard one in remoting, comes at it from the opposite problem of image recovery…. Still lots to learn for me!
Rachel
LikeLike
Nice! I will read through your article, and thank you for sharing. You should have told me about localized basis sets 35 years ago. 🙂 More promising was doing cross-correlations with standard spectral templates, but there were still issues with slope deviations and flaws. If I had to tackle this again, I’d probably try to do something with direct image recognition along the lines of what NVIDIA and Google are doing with image classification.
LikeLike